The results are in for D2D 5.0. As usual, AFHTO members have full access to all the data through the interactive report. A summary of performance at the province and LHIN levels is available on AFHTO’s public web page. Some of the highlights from this most recent release of D2D are listed below.
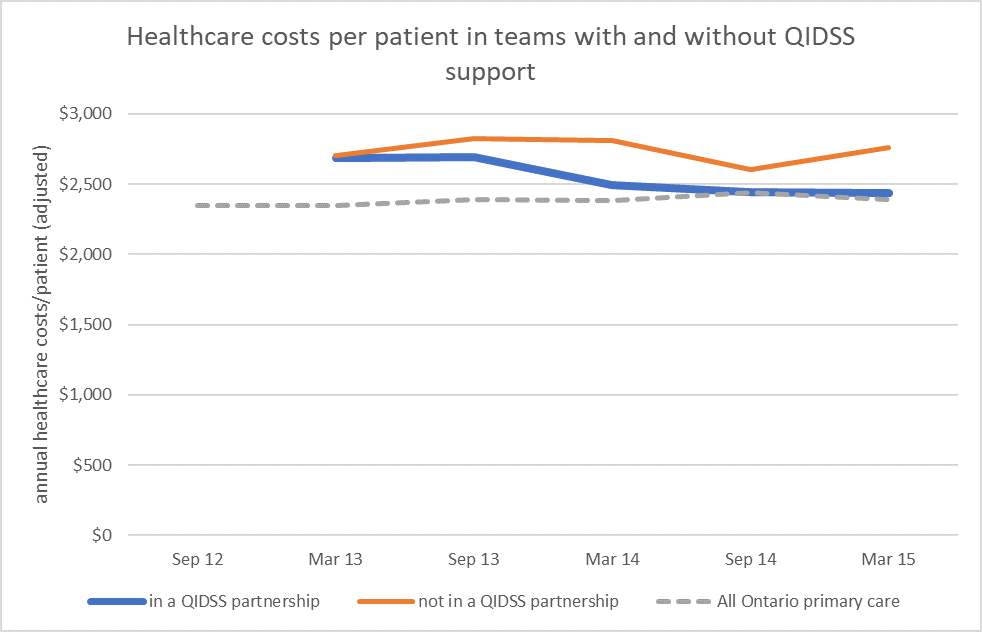
- The good news about cost continues! D2D 5.0 shows a continuing downward trend in healthcare costs among patients of teams, particularly those supported by QIDSS.
- High quality STILL is related to lower cost: AFHTO members keep showing that measuring quality in a way that reflects what matters to patients helps demonstrate the value of team-based primary care.
- Participation in measurement remains high and growing: A few new teams joined two-thirds of their peers to contribute even more data for more indicators, compared to previous iterations.
- Quality improvement activity remains high too: Performance is holding. Conversations are continuing and integration between EMRs and hospitals is growing. Stay tuned for more analysis coming soon from the new “team characteristics” aspect of D2D.
- Sub-region reporting is here: AFHTO members can now compare performance to peers within their own sub-region. External partners can connect with teams in the sub-regions for more information.
- Opening up to learning: 36 teams have taken the big step to completely open reporting. They and their peers can now easily contact each other to compare notes on performance.
- Coming soon – FINALLY! What makes a high performing team? Thanks to nearly 90 teams who shared data about their team’s characteristics, AFHTO members can now start to unravel the mystery of what makes a high performing team.
What’s Next?
After Data, then Decisions! The next steps with D2D are about using the data. AFHTO members are invited to a post-launch webinar on October 12th to share stories about using D2D to move beyond measurement to improvement. In the meantime, members can check out change ideas and other resources to support improvement through AFHTO’s Information to Action initiative.
Good news re: cost
The average healthcare cost per person (adjusted for patient complexity) is on a downward trend, especially for teams supported by QIDSS. The average healthcare costs for each patient served by teams with QIDSS support is just under $2500 per year as of March 2015, the most recent year for which data are available. D2D 5.0 is showing that these costs are starting to drop, even while costs across the province are relatively stable. This is consistent with other analyses which illustrate that the introduction of team-based care in Ontario was associated with moderate improvements in processes related to some aspects of chronic disease management (Kiran et al., 2015).
High quality is related to lower costs
The relationship between higher quality and lower healthcare system cost persists in D2D 5.0. The relationship remains stronger among non-rural teams, for whom just under half of the variation in total cost (not including LTC institutionalization costs) is explained by variation in the composite quality score, once patient complexity is considered. (The Quality Roll Up Indicator is a composite score based on 14 measures covering as many of Starfield's 4Cs (first Contact accessibility, Coordination, Comprehensiveness, and Continuity) and weighted according to what’s important to patients). The strength and robustness of the analysis continues to grow slowly with the addition of new teams to the data set each iteration and the increasing amount of data available for each contributing team. Work continues to validate the structure of the QRU to further reduce the data capture burden associated with the generation of the composite measure.
Participation remains high and growing
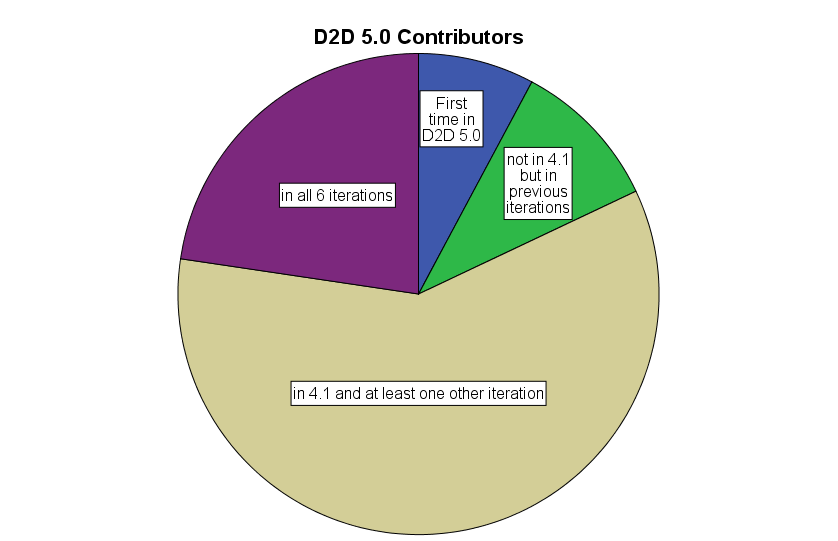
- 122 (66%) teams contributed to D2D 5.0, slightly up from 117 teams in D2D 4.1. The history of contribution among D2D 5.0 teams is shown in figure 1. Overall, 172 (or 93% of 184 teams) have contributed to at least one iteration, with 22% of members contributing to only one iteration and 64% contributing to 3 or more (data not shown).
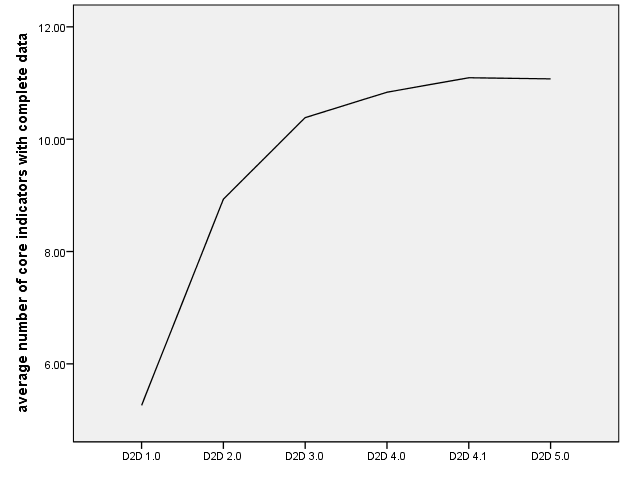
- More data being contributed for each team: The average number of indicators for which teams had complete data has gone up steadily, plateauing at an average of about 11 out of 15. Work is underway to validate the Quality Roll-Up indicator’s structure with the hope of reducing the number of indicators required to generate it. This might reduce and focus data capture burden for teams.